seekrays/mcp-monitor
A system monitoring tool that exposes system metrics via the Model Context Protocol (MCP). This tool allows LLMs to retrieve real-time system information through an MCP-compatible interface.(support CPU、Memory、Disk、Network、Host、Process)
Claude Desktop config.json'a ekle
{
  "mcpServers": {
    "seekrays-mcp-monitor": {
      "command": "node",
      "args": [
        "~/.mcp/mcp-monitor/index.js"
      ]
    }
  }
}
Kaynak kodu al ve yerel olarak çalıştır
git clone https://github.com/seekrays/mcp-monitor.git ~/.mcp/mcp-monitor
cd ~/.mcp/mcp-monitor
Bu MCP sunucusu hakkında
MCP System Monitor
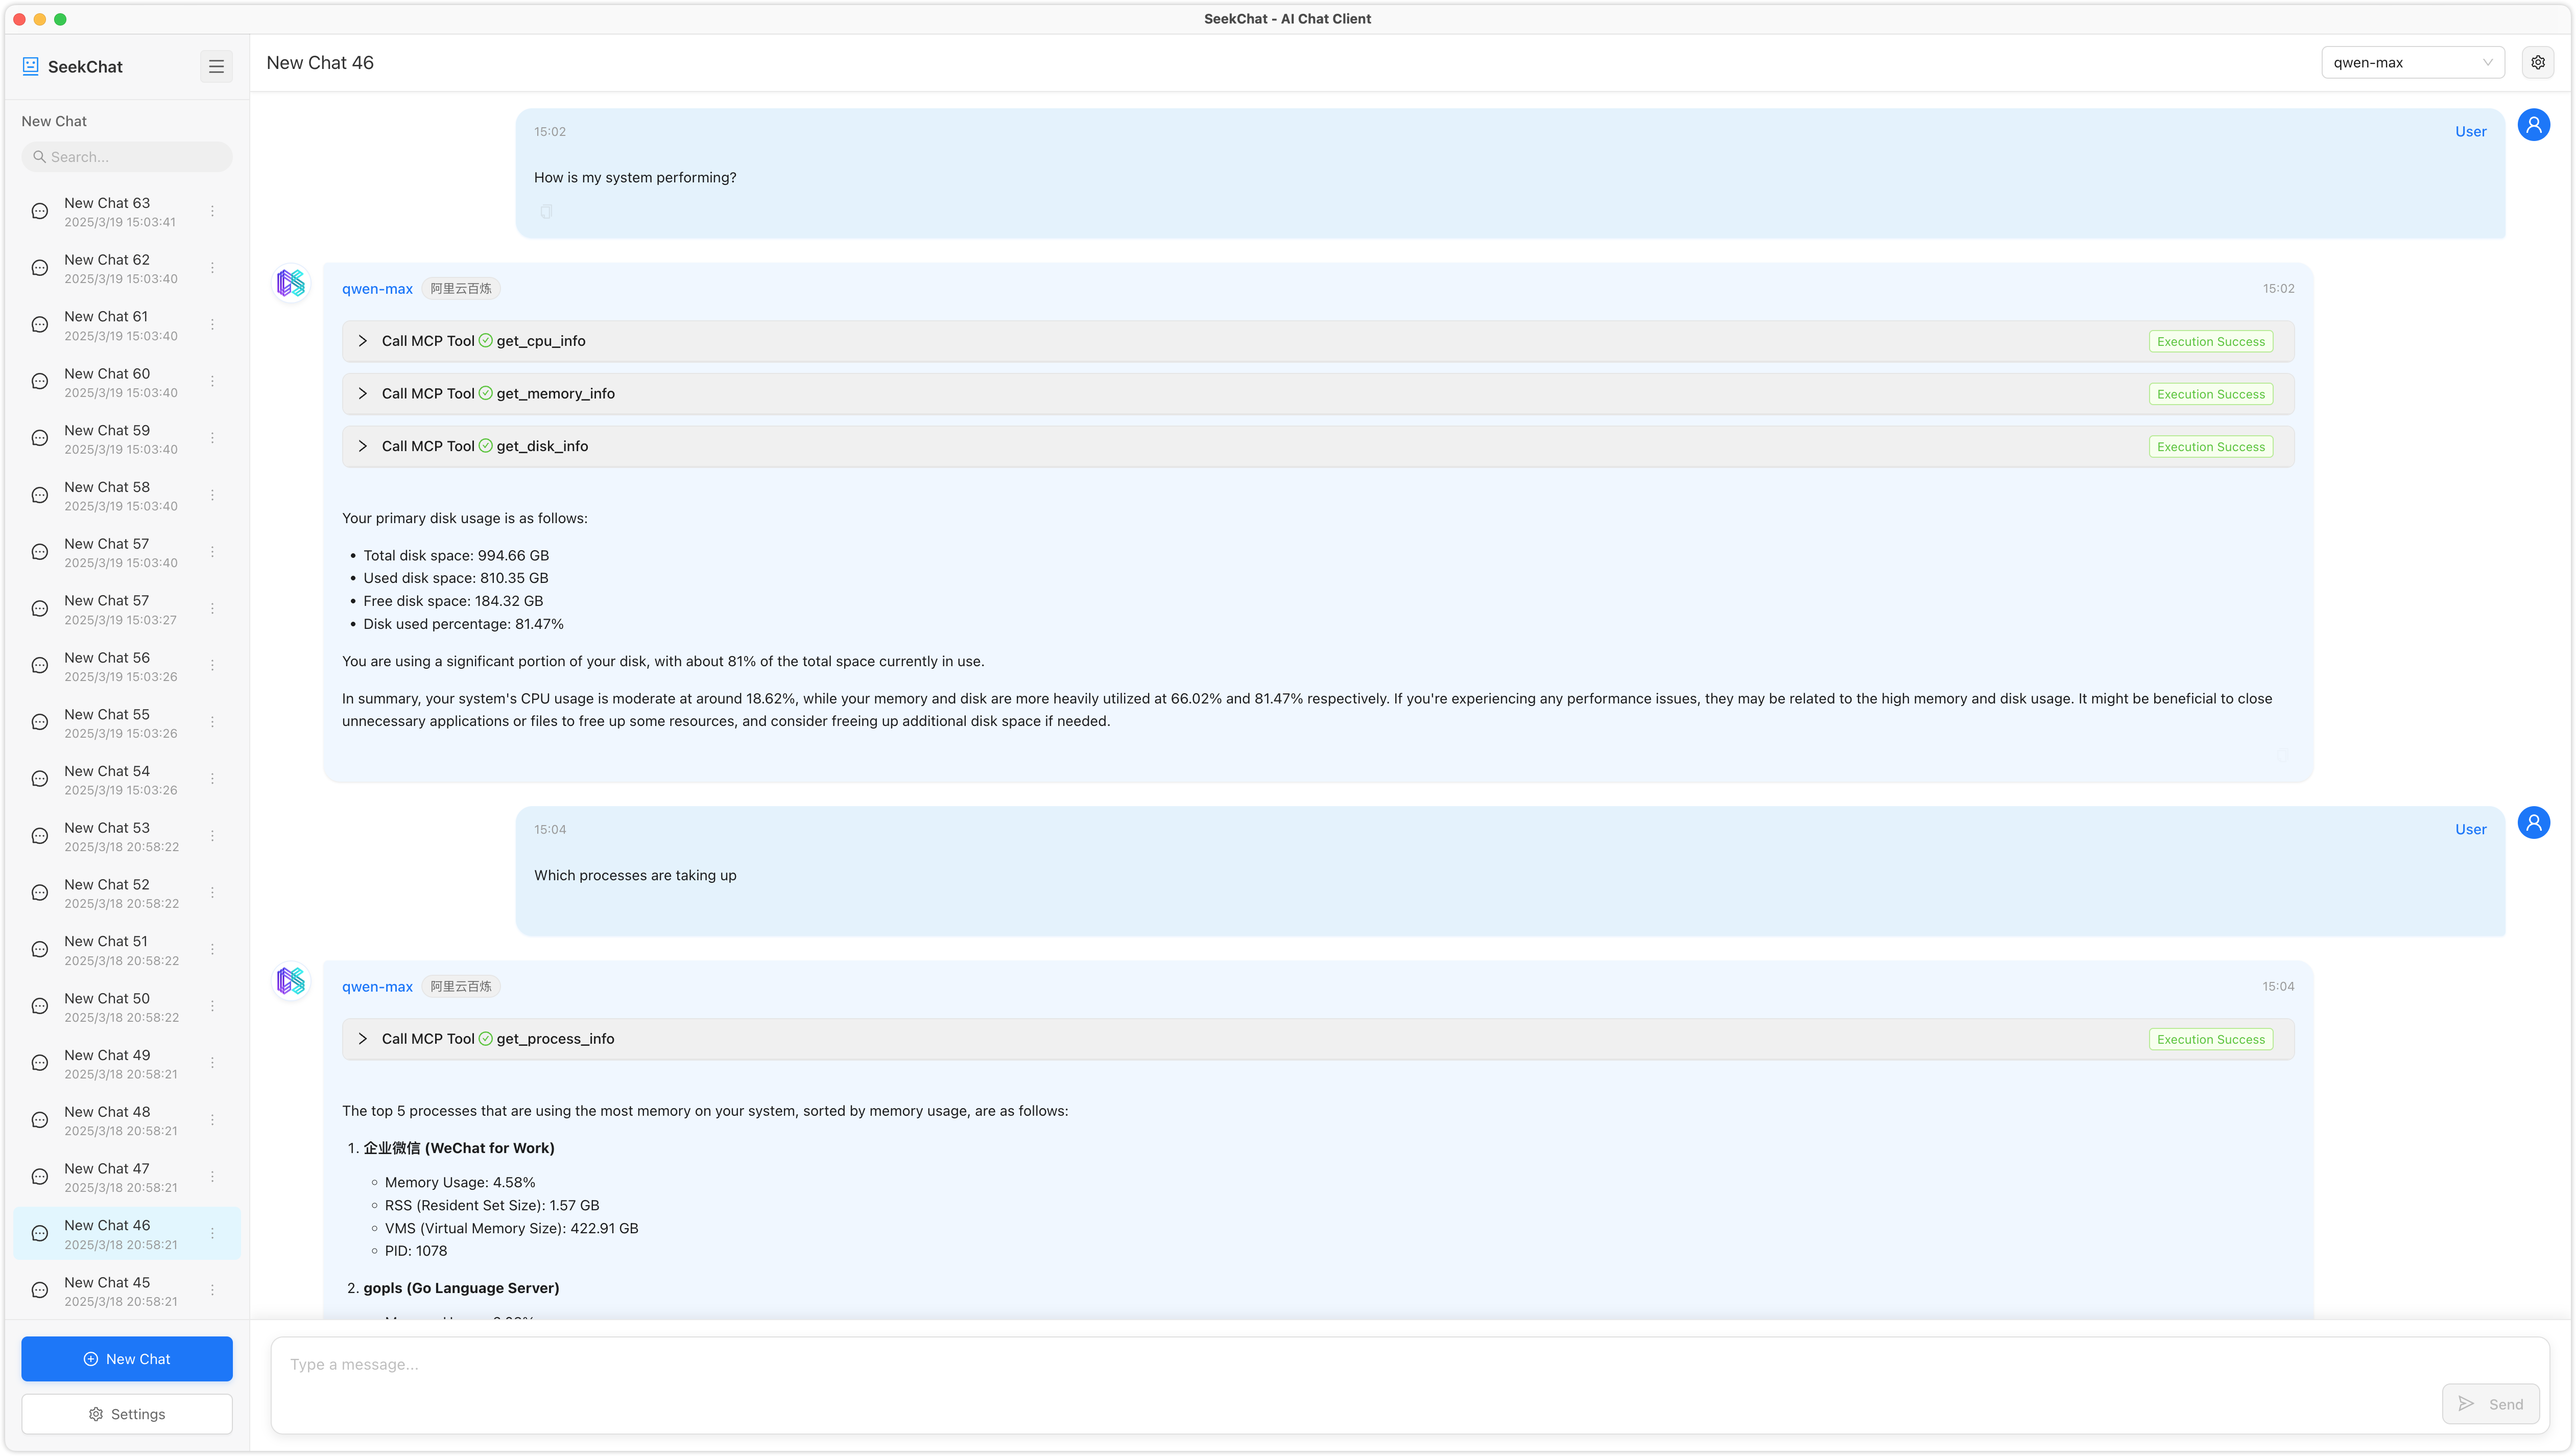
![]()

A system monitoring tool that exposes system metrics via the Model Context Protocol (MCP). This tool allows LLMs to retrieve real-time system information through an MCP-compatible interface.
Features
This tool provides the following monitoring capabilities:
- CPU Information: Usage percentage, core count, and detailed CPU info
- Memory Information: Virtual and swap memory usage
- Disk Information: Disk usage, partitions, and I/O statistics
- Network Information: Network interfaces, connections, and traffic statistics
- Host Information: System details, uptime, boot time, and users
- Process Information: Process listing, sorting, and detailed per-process statistics
Available Tools
1. CPU Information
Tool: get_cpu_info
Description: Get CPU information and usage
Parameters:
  - per_cpu (boolean, default: false): Whether to return data for each core
2. Memory Information
Tool: get_memory_info
Description: Get system memory usage information
Parameters: None
3. Disk Information
Tool: get_disk_info
Description: Get disk usage information
Parameters:
  - path (string, default: "/"): Specify the disk path to query
  - all_partitions (boolean, default: false): Whether to return information for all partitions
4. Network Information
Tool: get_network_info
Description: Get network interface and traffic information
Parameters:
  - interface (string, optional): Specify the network interface name to query
5. Host Information
Tool: get_host_info
Description: Get host system information
Parameters: None
6. Process Information
Tool: get_process_info
Description: Get process information
Parameters:
  - pid (number, optional): Process ID to get detailed information for a specific process
  - limit (number, default: 10): Limit the number of processes returned
  - sort_by (string, default: "cpu"): Sort field (cpu, memory, pid, name)
Installation
git clone https://github.com/seekrays/mcp-monitor.git
cd mcp-monitor
make build
Usage
Run the compiled binary:
./mcp-monitorThe server starts in stdio mode, ready to communicate with an MCP-compatible LLM client.
Contributing
Contributions are welcome! Please feel free to submit a Pull Request.
Benzer MCP sunucuları
Discovery, exploration, reporting and root cause analysis using all observability data, including metrics, logs, systems, containers, processes, and network connections.
Search dashboards, investigate incidents and query datasources in your Grafana instance
Sentry.io integration for error tracking and performance monitoring
Zabbix integration for hosts, items, triggers, templates, problems, data and more.
Provides comprehensive integration with your VictoriaMetrics instance APIs and documentation for monitoring, observability, and debugging tasks related to your VictoriaMetrics instances
Provides access to OpenTelemetry traces and metrics through Logfire